

Unexplained memory leak? Free RAM goes down over time

Hi LowEndHelpDesk, ![]()
I have a VPS with 2GB of memory. I don't use it a lot, leaving it mostly idle except the IPv6 BGP session (over 6in4) I have with he.net and NetAssist. I don't load the routing table; I just route everything to he.net.
However, I noticed that the memory usage increases slowly over time. I need to hard-reset the VPS every few weeks to restore it. This behaviour started roughly since 2020 started but I haven't made any significant changes to the configuration
Thanks to this beautiful graph from hetrixtools hopefully it explains better:
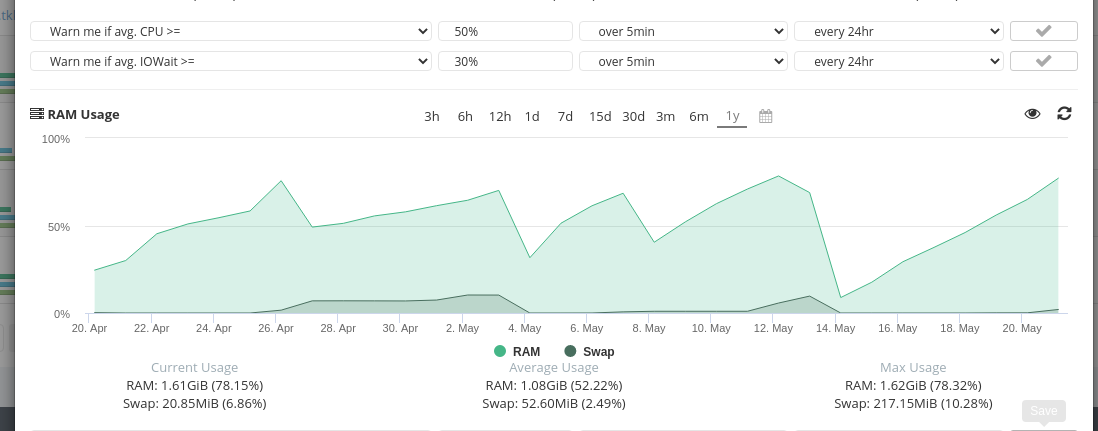
Memory usage is quite high:
[me@lax2 ~]$ free -h
              total        used        free      shared  buff/cache   available
Mem:          2.1Gi       1.6Gi        95Mi       1.0Mi       366Mi       289Mi
Swap:         303Mi        20Mi       283Mi
You can see that there's actually no application actively consuming memory:
[me@lax2 ~]$ ps aux
USER         PID %CPU %MEM    VSZ   RSS TTY      STAT START   TIME COMMAND
root           1  0.0  0.3 109744  8264 ?        Ss   May13   5:58 /sbin/init
root           2  0.0  0.0      0     0 ?        S    May13   0:00 [kthreadd]
root           3  0.0  0.0      0     0 ?        I<   May13   0:00 [rcu_gp]
root           4  0.0  0.0      0     0 ?        I<   May13   0:00 [rcu_par_gp]
root           6  0.0  0.0      0     0 ?        I<   May13   0:00 [kworker/0:0H-kblockd]
root           8  0.0  0.0      0     0 ?        I<   May13   0:00 [mm_percpu_wq]
root           9  0.0  0.0      0     0 ?        S    May13   1:39 [ksoftirqd/0]
root          10  0.0  0.0      0     0 ?        S    May13   0:00 [rcuc/0]
root          11  0.0  0.0      0     0 ?        I    May13  11:11 [rcu_preempt]
root          12  0.0  0.0      0     0 ?        S    May13   0:00 [rcub/0]
root          13  0.0  0.0      0     0 ?        S    May13   0:04 [migration/0]
root          14  0.0  0.0      0     0 ?        S    May13   0:00 [idle_inject/0]
root          16  0.0  0.0      0     0 ?        S    May13   0:00 [cpuhp/0]
root          17  0.0  0.0      0     0 ?        S    May13   0:00 [kdevtmpfs]
root          18  0.0  0.0      0     0 ?        I<   May13   0:00 [netns]
root          19  0.0  0.0      0     0 ?        S    May13   0:00 [rcu_tasks_kthre]
root          20  0.0  0.0      0     0 ?        S    May13   0:03 [kauditd]
root          21  0.0  0.0      0     0 ?        S    May13   0:00 [khungtaskd]
root          22  0.0  0.0      0     0 ?        S    May13   0:00 [oom_reaper]
root          23  0.0  0.0      0     0 ?        I<   May13   0:00 [writeback]
root          24  0.0  0.0      0     0 ?        S    May13   0:01 [kcompactd0]
root          25  0.0  0.0      0     0 ?        SN   May13   0:00 [ksmd]
root          26  0.0  0.0      0     0 ?        SN   May13   0:00 [khugepaged]
root         114  0.0  0.0      0     0 ?        I<   May13   0:00 [kintegrityd]
root         115  0.0  0.0      0     0 ?        I<   May13   0:00 [kblockd]
root         116  0.0  0.0      0     0 ?        I<   May13   0:00 [blkcg_punt_bio]
root         117  0.0  0.0      0     0 ?        I<   May13   0:00 [ata_sff]
root         118  0.0  0.0      0     0 ?        I<   May13   0:00 [edac-poller]
root         119  0.0  0.0      0     0 ?        I<   May13   0:00 [devfreq_wq]
root         120  0.0  0.0      0     0 ?        S    May13   0:00 [watchdogd]
root         121  0.0  0.0      0     0 ?        S    May13   4:59 [kswapd0]
root         124  0.0  0.0      0     0 ?        I<   May13   0:00 [kthrotld]
root         125  0.0  0.0      0     0 ?        I<   May13   0:00 [acpi_thermal_pm]
root         126  0.0  0.0      0     0 ?        I<   May13   0:00 [nvme-wq]
root         127  0.0  0.0      0     0 ?        I<   May13   0:00 [nvme-reset-wq]
root         128  0.0  0.0      0     0 ?        I<   May13   0:00 [nvme-delete-wq]
root         129  0.0  0.0      0     0 ?        I<   May13   0:00 [ipv6_addrconf]
root         140  0.0  0.0      0     0 ?        I<   May13   0:00 [kstrp]
root         146  0.0  0.0      0     0 ?        I<   May13   0:00 [zswap-shrink]
root         147  0.0  0.0      0     0 ?        I<   May13   0:00 [kworker/u3:0]
root         158  0.0  0.0      0     0 ?        I<   May13   0:00 [charger_manager]
root         188  0.0  0.0      0     0 ?        S    May13   0:00 [scsi_eh_0]
root         189  0.0  0.0      0     0 ?        I<   May13   0:00 [scsi_tmf_0]
root         190  0.0  0.0      0     0 ?        S    May13   0:00 [scsi_eh_1]
root         191  0.0  0.0      0     0 ?        I<   May13   0:00 [scsi_tmf_1]
root         195  0.0  0.0      0     0 ?        I<   May13   0:15 [kworker/0:1H-kblockd]
root         206  0.0  0.0      0     0 ?        S    May13   0:10 [jbd2/vda2-8]
root         207  0.0  0.0      0     0 ?        I<   May13   0:00 [ext4-rsv-conver]
root         234  0.0  2.2 172832 47940 ?        Ss   May13   3:28 /usr/lib/systemd/systemd-journald
root         242  0.0  0.0  78076   688 ?        Ss   May13   0:00 /usr/bin/lvmetad -f
root         247  0.0  0.2  30940  4732 ?        Ss   May13   0:02 /usr/lib/systemd/systemd-udevd
systemd+     250  0.0  0.2  26260  5208 ?        Ss   May13   0:05 /usr/lib/systemd/systemd-networkd
systemd+     276  0.0  0.1  91784  4276 ?        Ssl  May13   0:03 /usr/lib/systemd/systemd-timesyncd
root         289  0.0  0.0   6588  1968 ?        Ss   May13   0:07 /usr/bin/crond -n
dbus         290  0.0  0.1   6780  2772 ?        Ss   May13   3:35 /usr/bin/dbus-daemon --system --address=systemd: --nofork --nopidfile --systemd-activation --syslog-only
root         291  0.0  0.2  17504  5660 ?        Ss   May13   1:47 /usr/lib/systemd/systemd-logind
v2ray        294  0.1  0.6 1168500 13268 ?       Ssl  May13  14:52 /usr/bin/v2ray -config /etc/v2ray/0.json
bird         295  0.0  0.0   7156  1268 ?        Ss   May13   2:00 /usr/bin/bird -s /run/bird/bird.ctl
root         296  0.0  0.0   5424  1304 tty1     Ss+  May13   0:00 /sbin/agetty -o -p -- \u --noclear tty1 linux
http         315  0.0  0.5 1255500 12164 ?       Ssl  May13   0:54 /usr/bin/caddy -log stdout -agree -conf /etc/caddy/caddy.conf -root=/usr/share/caddy
root     3555765  0.0  0.0      0     0 ?        I    21:27   0:00 [kworker/0:0-rcu_gp]
root     3566553  0.0  0.0      0     0 ?        I    21:33   0:00 [kworker/u2:1-ext4-rsv-conversion]
root     3567234  0.0  0.0      0     0 ?        I    21:33   0:00 [kworker/0:1-events]
root     3569037  0.0  0.3  10704  7448 ?        Ss   21:34   0:00 sshd: me [priv]
me    3569138  0.0  0.4  18972  9776 ?        Ss   21:34   0:00 /usr/lib/systemd/systemd --user
me    3569140  0.0  0.0 113348  2116 ?        S    21:34   0:00 (sd-pam)
me    3569145  0.0  0.1  10704  4156 ?        S    21:34   0:00 sshd: me@pts/0
me    3569146  0.0  0.1   7488  4000 pts/0    Ss   21:34   0:00 -bash
root     3577610  0.0  0.0      0     0 ?        I    21:38   0:00 [kworker/u2:0-flush-254:0]
root     3584705  0.1  0.0      0     0 ?        I    21:42   0:00 [kworker/0:2-events]
root     3588276  0.0  0.0      0     0 ?        I    21:44   0:00 [kworker/u2:2-events_unbound]
root     3591768  0.0  0.1   9636  3600 ?        S    21:46   0:00 /usr/bin/CROND -n
hetrixt+ 3591769  0.0  0.1   7144  2860 ?        Ss   21:46   0:00 /bin/sh -c bash /etc/hetrixtools/hetrixtools_agent.sh >> /etc/hetrixtools/hetrixtools_cron.log 2>&1
hetrixt+ 3591770  0.3  0.1   7144  3392 ?        S    21:46   0:00 bash /etc/hetrixtools/hetrixtools_agent.sh
hetrixt+ 3593070  0.0  0.0   7144  1816 ?        S    21:46   0:00 bash /etc/hetrixtools/hetrixtools_agent.sh
hetrixt+ 3593071  0.0  0.0   7972  1184 ?        S    21:46   0:00 vmstat 3 2
hetrixt+ 3593072  0.0  0.0   5340   580 ?        S    21:46   0:00 tail -1
me    3593073  0.0  0.1   9500  3596 pts/0    R+   21:46   0:00 ps aux
[me@lax2 ~]$ cat  /proc/meminfo
MemTotal:        2163084 kB
MemFree:          111300 kB
MemAvailable:     302496 kB
Buffers:            5500 kB
Cached:            70908 kB
SwapCached:         1008 kB
Active:            56160 kB
Inactive:          54484 kB
Active(anon):      10912 kB
Inactive(anon):    22148 kB
Active(file):      45248 kB
Inactive(file):    32336 kB
Unevictable:           0 kB
Mlocked:               0 kB
SwapTotal:        311292 kB
SwapFree:         289952 kB
Dirty:                 8 kB
Writeback:             0 kB
AnonPages:         33544 kB
Mapped:            46160 kB
Shmem:              1624 kB
KReclaimable:     284608 kB
Slab:            1881652 kB
SReclaimable:     284608 kB
SUnreclaim:      1597044 kB
KernelStack:        1520 kB
PageTables:         1616 kB
NFS_Unstable:          0 kB
Bounce:                0 kB
WritebackTmp:          0 kB
CommitLimit:     1392832 kB
Committed_AS:     476668 kB
VmallocTotal:   34359738367 kB
VmallocUsed:       10888 kB
VmallocChunk:          0 kB
Percpu:            37680 kB
HardwareCorrupted:     0 kB
AnonHugePages:         0 kB
ShmemHugePages:        0 kB
ShmemPmdMapped:        0 kB
FileHugePages:         0 kB
FilePmdMapped:         0 kB
HugePages_Total:       0
HugePages_Free:        0
HugePages_Rsvd:        0
HugePages_Surp:        0
Hugepagesize:       2048 kB
Hugetlb:               0 kB
DirectMap4k:     1665012 kB
DirectMap2M:      563200 kB
Any ideas?
Comments
Looks like it's all being eaten by Slab? Which iirc is kernel-related cache. Try
slabtopand maybe that can give you some hints, or you can share the output here for someone much smarter than myself to help with. lol🦍🍌
Thanks for the pointers! I never realised slab is a thing. Here's the output from slabtop and I will continue Googling tomorrow:
What does cat /proc/slabinfo give?
“Technology is best when it brings people together.” – Matt Mullenweg
V2ray and caddy in-memory cache?
What is
cred_jarunder slabinfo? I have to reboot my box every week, otherwise the box will become unresponsive after 8 or 9 days.